Tools for brain imaging data analysis
Here’s a list of the tools I mainly use for the analysis of brain imaging data including anatomical T1-weighted magnetic resonance imaging (MRI) data, functional MRI (fMRI), and diffusion MRI (dMRI), among others:
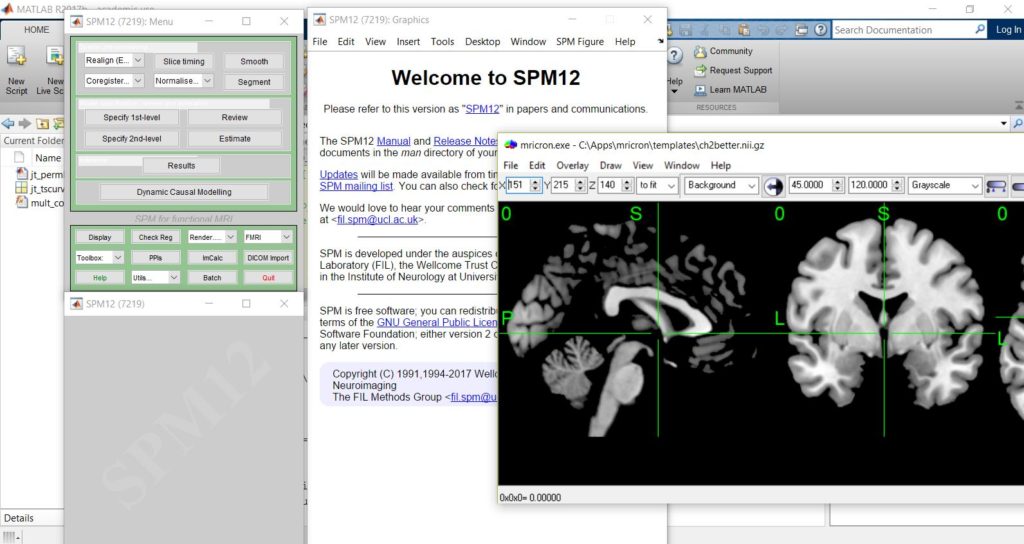
SPM12 – Statistical Parametric Mapping. SPM is freely available after completing a download form from the website. To run SPM, you will need Matlab, which unfortunately is not free. SPM is a full analysis package you can use to analyze fMRI data from preprocessing to statistical analysis. Aside from the very helpful graphical user interface (GUI), you can also use most of its functions in your own scripts.
FSL – FMRIB Software Library. FSL is a comprehensive library of analysis tools for functional MRI and DWI dataset. FSL is readily available in Linux and Mac systems. With the Windows Subsystem for Linux, you can also run FSL in computers running Windows 10. Alternatively, you can run FSL in Windows using a Linux virtual machine.
MRIcron – This software is not really used for analysis but for viewing NIFTI-formatted images. It is a very handy tool to quickly view MR images. You can also overlay other images, such as statistical parametric maps, to quickly visualize your results. Distributed with MRIcron is the dcm2nii converter, very useful for converting DICOM images, the format used in most MRI scanners, to the NIFTI format.
GRETNA – GRETNA is a toolbox which is very useful for network analysis based on graph theory. You can use it to compute different network measures such as path length, degree, global and local efficiency, among others. It requires MATLAB and may also need SPM to initially preprocess fMRI data.
MRtrix3 – MRtrix3 provides a full set of tools to analyze diffusion MRI data from image preprocessing to group-level analysis. Using MRtrix3, you can extract measures such as fiber density, fiber cross section, and the combined measure of fiber density and cross section. It is also possible to do whole brain tractography and structural connectivity, among others.
BrainNet Viewer – This tool is very useful for brain network visualization for both functional and structural connectivity patterns. You can also use this to visualize 3D whole brain activation maps.